Profiling
In some ways, profiling is similar to debugging. Both are used to examine application flow as well as isolate problems in code. However, debugging is used to check the correctness of code, while profiling is used to inspect the performance of code.
Profiling allows analysis of application behavior in order to recognize how to make the application more efficient. This analysis would be impossible to accomplish by debugging alone.
Profiling has several distinct advantages and uses. It helps identify many behaviors and problems, including:
Memory leaks/inefficient memory usage
Poor method response times
Thread deadlocks
Frequent code block usage ("hot spots")
Profiling with WSAD involves four major pieces:
The JVM
An agent running in the JVM (via JVMPI)
An agent controller
WSAD's Performance Analyzer
Profiling in Java is made possible through Sun's Java Virtual Machine Profiler Interface (JVMPI). A JVMPI implementation (known as the agent) runs as part of a standard JVM. The agent receives and records information from the JVM, such as thread activity and objects being garbage collected. The agent may also make requests for additional information or deactivate further notifications of specific events. The profiling agent is managed by an agent controller, which resides outside of the JVM and acts independently. In the case of WSAD, an extra component, called the Performance Analyzer, acts as an interface for the development environment and the agent controller. The Performance Analyzer can monitor applications locally or on remote machines, as long the remote machine has an agent controller installed and running.
WSAD allows you to profile applications on JVMs that have the agent controller already installed. This includes applications that are:
Stand-alone
Running remotely (including server-side apps)
Running across multiple JVMs
The profiling process can collect a lot of information, and therefore must keep track of many items, including:
Instantiated objects
Garbage-collected objects
Method calls
Method execution time
Memory consumption
Due to the amount of information that must be recorded, profiling can be very slow. Each application reacts differently when profiled. The degree to which performance is affected depends on a number of factors such as connection quality to the remote host, database connectivity, or application complexity. To help optimize the time-consuming process of data collection, we use filters.
Filters allow you to specify which information to profile. For instance, when concerned only with the behavior of classes in a particular package, the agent can be configured to ignore information related to all other packages. Limiting the number of packages to keep track of reduces the amount of data being collected and recorded. Having less data to record helps increase profiling performance. In WSAD, filters are set when using the profiling wizard or by going to Window > Preferences > Profiling and Logging > Profiling. Filters are usually set per package - not for individual classes.
There are two main ways of recording the amount of time spent executing a method: base time and cumulative time.
Base time is the actual amount of time that the method spends executing.
Cumulative time is the total amount of time that the method spends executing itself, plus the time of all methods that it calls. WSAD uses wall time - not CPU time.
Heap View (WSAD 5.0.0 only) 0
The Heap view is used to identify objects or methods using the most resources. The information displayed is organized by object statistics or method statistics and is the most flexible of the graphical views. Colored blocks in the lower right portion of the view represent objects and method calls. Class names and array types are displayed to the left of their respective colored blocks.
The "Color By" property determines what the color of the blocks means. Each shade of color represents a numeric value. Blue represents the low end of the threshold, and red represents the high end. Numeric values between blue and red are shown by shades that are the result of mixtures of blue and red. Black represents zero and is the only other color used. A slide bar at the top of the view is used to adjust the threshold at which blocks are given a particular color.
For example, when viewing method information, selecting the "Number of Calls" in the Color By property means blue blocks are methods that have been called less than methods represented by red blocks. Assume that red represents 25. Moving the slider down to 15 will readjust the color of the blocks accordingly. 1
When viewing object information, you have Color By options for:
Base time
Cumulative time 2
Number of calls
Number of threads
Active memory 3
The Color By choices for method data include:
Base time
Cumulative time 4
Number of calls
Execution Flow View
The Execution Flow view shows all threads in the application. For each thread, vertical bars represent methods invoked. Time is represented vertically. The placement and length of each method bar indicates when the method was called and how long it ran for. By using this view to show all threads, method calls, and the length of method calls, you can get an overview of how your entire application is running. In other words, you can see such details as thread activity, how long method calls are taking, and which ones are taking the longest - all at a single glance. 5
The Execution Flow view and table both show a representation of the entire program execution. In the view, the threads of the program fit horizontally, and time is scaled so that the entire execution fits vertically. In the table, the threads are grouped in the first column and time is recorded in successive rows.
The Execution Flow view and table are available only if the collection of execution flow information has been enabled, which you do when launching or attaching to the application to be profiled. Select the profiling option, My application is too slow then, from the Details options, select Show Execution flow graphical details.
Here is an example of the Execution Flow view: 6
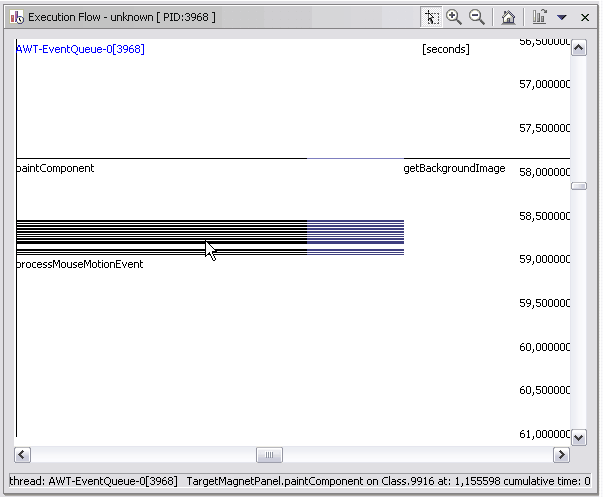
Stripes cascade to the right as one method calls another method, whose responding method in turn calls another method, and so on. Stripes are grouped in columns by thread. A thin, black vertical line separates one column from another. The name of each thread appears at the top of its column.
Note: Class types can be given unique colors to distinguish what each vertical bar represents.
Method Invocation View 7
The Method Invocation view is nearly identical to the Execution Flow view. This view, however, shows more specific data and has the added functionality of navigating method calls. In the Method Invocation view, a single method is examined. Toolbar options allow you to automatically switch the data displayed to:
The calling method
A method being invoked by the selected method 8
The next time the selected method is called
The last time the method was called
Method Execution View 9
The Method Execution view is similar in nature to the Method Invocation view. The main difference is that the data displayed in this view is basically a compacted overview of the data shown in the Method Invocation view. The Method Execution view displays patterns of functionality. Time has a different meaning than in the other views, representing either the total or average amount of time the method was functioning. Think of this view as an abstract summary of all calls made to a single method.
Object References View
The Object References view can help identify memory leaks and locations where references to objects are still being held. Because the data displayed in this view is similar to that in the Heap view, the Object References view can be considered a detailed version of the objects shown in the Heap view. The type of objects shown can be narrowed by the choices in the Display dropdown box. 0
Note: In order to view this data, you need to select "Collect Object References" by right-clicking on the desired process in the Profile Monitor view while profiling.
Sequence Diagram View
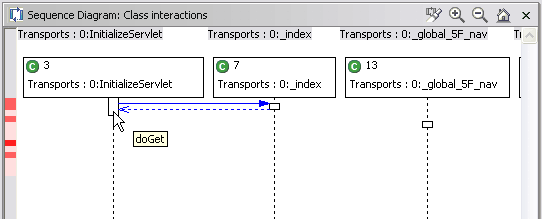
The Sequence Diagram view uses the Unified Modeling Language (UML) form of sequence diagram to present much of the same data as the Execution Flow view. Method calls, returns, and overall flow of an application can be examined from this view. The Sequence Diagram view can also be used to identify hot spots and thread issues such as deadlocks. Unlike most of the other graphical views, the lengths of vertical bars (representing method calls) do not signify elapsed time. However, method call times can still be viewed by placing your mouse over the method calls. 1
Execution Flow Table
This view is the tabular equivalent of the graphical Execution Flow view, which displays threads, method calls, method call times, and class types. The Execution Flow Table view displays method information in a tree format. Profiled threads make up the root of each tree. Each method that calls another method makes up another level of the tree that can be expanded or collapsed. When a method node is collapsed, only the start time of the method and total cumulative data are displayed. When the node is expanded, the same type of data is displayed but is also shown for individual statistics of every method called.
Method Invocation Table 2
The Method Invocation Table view is the tabular representation of data shown in the Method Invocation view.
Object References Table
The Object References Table view is the table form of the data presented in the Object References view. 3
The Object References table displays references to or from a set of objects. This is useful to study data structures, to find memory leaks, and to find unexpected references.
To display information on this table, you first need to run Collect Object References on the active process (right click on the active process, then select Collect Object References).
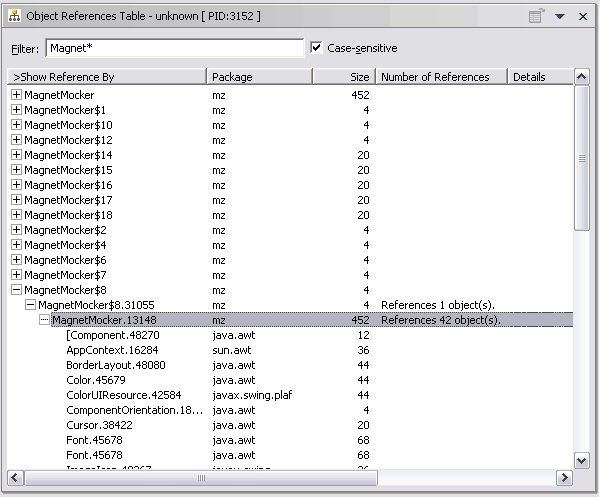
The Show Reference To/By column displays a tree. The first level of the tree shows the classes loaded by the application. At this level, the Size column shows the active size for the corresponding classes. The content of the display differs depending on whether Show Reference To or Show Reference By is chosen. 4
Here is an example of the table with Show Reference By selected:
Displays a tree of objects referencing the selected class objects. As you go deeper in the tree, each successive level show the objects referencing the previous ones.
Class Instance Statistics 5
The Class Instance Statistics view displays information related to class types. This includes data concerning the number of instances created, amount of memory used, garbage collection, and amount of time spent executing functionality.
Instance Statistics
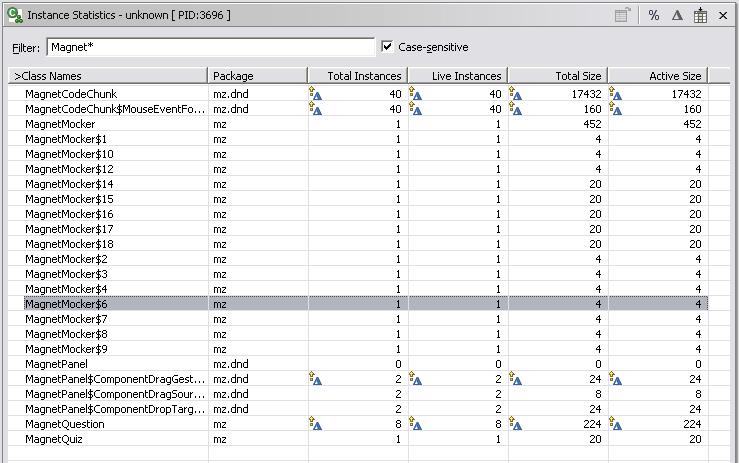
The Instance Statistics view is similar to the Class Instance Statistics view. What makes the Instance Statistics view different is that it lists actual object references. Note that the variable names used in code are not recorded. Instead, each object instance will have its individual statistics displayed. 6
Method Statistics
The Method Statistics view simply displays information such as method names, how many times each method was called, and the method stack tree. Of all the information shown, base time and cumulative time for each method are most likely what you will want to use this view for.

Class Method Statistics 7
The Class Method Statistics view displays method information organized by class, and is nearly identical to the Method Statistics view. Other than being organized by class type, the only difference between the two views is that this view also displays package information.
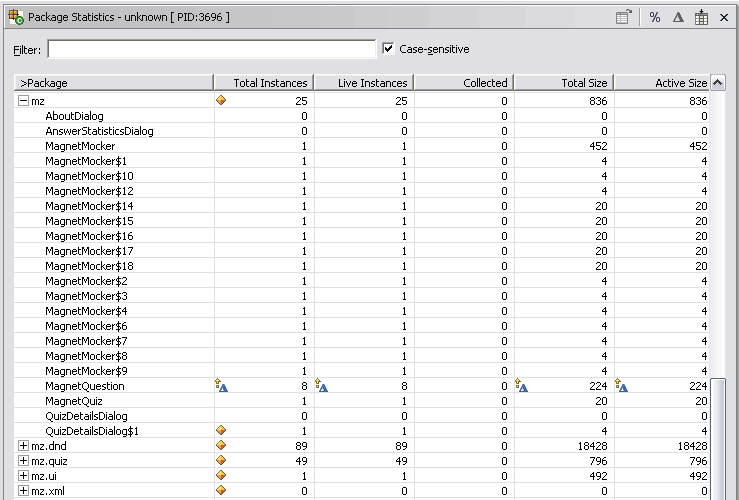
Package Statistics
The Package Statistics view allows you to examine information at a package level. This lets you take a high-level glance at what groups of classes may be causing problems. Once identified, you may expand the information of a specific package to possibly identify a class (or classes) that may be causing performance issues. Otherwise, you can use the other views to more accurately pinpoint the source of problems. 8
Memory Leaks / Inefficient Memory Usage
A memory leak occurs when data is no longer needed but cannot be unloaded from memory due to an error in coding. Mainly, when we talk about memory leaks we are referring to objects that remain in memory instead of being garbage-collected. Arguably, memory leaks are not possible in Java because once an object falls out of scope it will be garbage-collected. Though this is true, coding errors can still prevent unneeded objects from being garbage-collected at the earliest possible time (which essentially is a memory leak). This is an inefficient usage of memory and can possibly cause severe performance problems.
The WSAD profiling toolset has a handful of mechanisms to help identify memory leaks in applications. There are three main views in the WSAD Profiling perspective used to determine if memory leaks are occurring: 9
Instance Statistics view
Heap view
Object References view 0
NOTE: For performance and usability, IBM is adding a Class Statistics view to WSAD 5.0.1, which will replace Heap view.
Each of the three views requires collection of object reference data, accomplished at any point while profiling an application. To do so, in the Profiling Monitor view, right-click on the monitor for your application and select "Collect Object References". Collecting the references provides a snapshot of how objects are referencing each other, which objects have been garbage-collected, and which objects are held in memory. Also, invoke the garbage collector from the same right-click menu by selecting "Run Garbage Collection".
NOTE: To identify memory leaks, each of the three views requires enabling the "Collect instance-level information" option in the final step of the wizard when starting a new profiling process. 1
When checking for objects that have or have not been garbage-collected, the Instance Statistics view and Heap view provide the information at a glance. The Instance Statistics view provides information on each object instance recorded by the profiler. The "Collected" field displays "false" if the instance has not yet been garbage-collected and "true" if it has. As for the Heap view, the lower-right portion displays instance information graphically. Diamonds represent class objects, solid rectangles represent object instances still held in memory, and empty rectangles represent object instances that have been garbage-collected.
The Object References view provides a more detailed graphical representation of objects, as well as any references pointing to each object instance. By using the Instance Statistics and Heap views, objects that should have been garbage-collected are easily identified. Then, use the Object References view to locate the exact references that are preventing garbage collection. When the offending reference is found, simply right-click on the object holding the reference and select "Open Source" to view the code responsible.
Poor Method Response Times 2
Most often, poor method response times are related to object creation or the obtaining of resources (such as opening an input stream or establishing a connection). In some cases, nonintrusive solutions such as changing a JDBC driver are enough to boost performance. Unfortunately, more severe problems or issues beyond the control of the developer can also cause a performance nightmare (such as network traffic, outdated systems, etc.).
WSAD's Execution Flow, Execution Flow Table, and related views help isolate method or submethod calls responsible for abnormal execution times. Long method calls are easily identifiable using the graphical Execution Flow, Method Invocation, or Method Execution views. Each view represents method calls and times with vertical bars; thus long bars represent long execution times. To examine the statistics of a particular method, right-click on the vertical bar and select "Show Invocation Table" or "Show Execution Table", depending on which view is currently displayed.
The statistical data displayed for each method call or thread can be expanded to examine submethod calls. Doing so will help identify precisely which method or methods need modification to optimize performance. In each of the views mentioned above, right-clicking on any method will give the option "Open Source" to allow prompt examination of the offending code. 3
Hot Spots
Hot spots are areas of code that consume large amounts processing time. Hot spots can be broken down into two categories: long execution times or frequently accessed code blocks (resulting in large cumulative execution times).
A number of views help identify hot spots. The easiest view to use is the Sequence Diagram. The vertical bar on the left-hand side of the view contains red blocks. Darker red blocks represent methods or code blocks that take the most time to execute. Double-clicking on a red block marks each method involved in the long execution call. 4
Hot spots can also be identified using the Heap view. The Heap view displays method and object information, such as memory usage and execution time. It displays methods with excessive execution times as red blocks.
A hot spot may be the result of poor method performance or it may suggest a candidate for other optimization techniques such as refactoring or implementing a better algorithm.
Thread Issues 5
To test issues such as thread starvation, thread races, and deadlocks requires a thorough understanding of the application, potential pitfalls, and isolated tests focusing specifically on such issues. Graphical views are the best tools to rely on to identify thread-related problems. Graphical views allow finding long- or short-running threads at a glance.
The Execution Flow-type views can identify thread starvation issues. Thread starvation occurs when a thread is unable to perform an adequate amount of work in a given time frame. Possible reasons for thread starvation include higher-priority threads hogging CPU time or staying in a wait or locked state for frequent/long periods of time. When examining Execution Flow-type views, look for threads or method calls that have longer vertical bars (execution time) than expected.
Deadlocks are more easily spotted with the Sequence Diagram view. Method calls that fail to execute or return in addition to being flagged as a hot spot are potential deadlocks. 6
Log Views
There are three other views worth mentioning: Activity Log, Default Log, and Message Log.
Logging views are used to view errors, exceptions, and messages that may occur during profiling. Log files can further help identify performance issues and architectural problems. WSAD also allows log files to be used in conjunction with a symptom database (an XML file with explanations and possible solutions to information contained in a log file). 7
Note: Log files by default can be found at: "[yourWorkspace]/.metadata/LoggingUtil[ someID].log".
Symptom Database
One of the most useful tools for troubleshooting application errors is a symptom database. A symptom database is an XML file containing information for specific errors and messages. All the symptoms (errors and messages) have a suggested solution or at least a specified resource to refer to for more help. Some symptoms give a more detailed explanation of what caused the error. 8
When profiling or running an application, a log file containing messages, warnings, and errors is created by WAS and WSAD. This log file can be used in conjunction with a symptom database to resolve common problems. Preexisting symptom databases can be imported, or you can create your own.
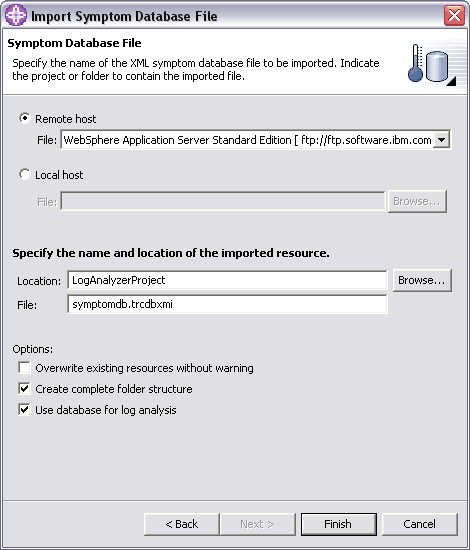
WSAD does not come with a default symptom database but one can be downloaded manually from IBM's public FTP site. Alternatively, you can use WSAD's import wizard to automatically download IBM's latest symptom database by following these steps:
Select File > Import... 9
Select "Symptom Database File" and click Next.
Specify symptom database location and target.
Select "Remote Host" and select the appropriate server type. 0
Specify which project will receive the symptom database.
WSAD should already be pointing to the appropriate filename.
Click Finish when you are ready. 1
To use a symptom database, an application or server log file must be imported (by selecting File > Import and choosing either "Logging Utilities XML Log File" or "WebSphere Application Server Log File"). The log file will display log entries that can be more closely examined. Right-click on an entry to display options to load a symptom database or analyze the entry against a symptom database that has already been loaded.
Enabling trace for a server
You can enable or disable trace support for a WebSphere test environment or server. You can use trace to obtain detailed information about the execution of run-time components, including application servers, clients, and other processes in the environment. Trace files show the time and sequence of methods called by run-time base classes, and you can use these files to pinpoint the failure. 2
To enable or disable tracing:
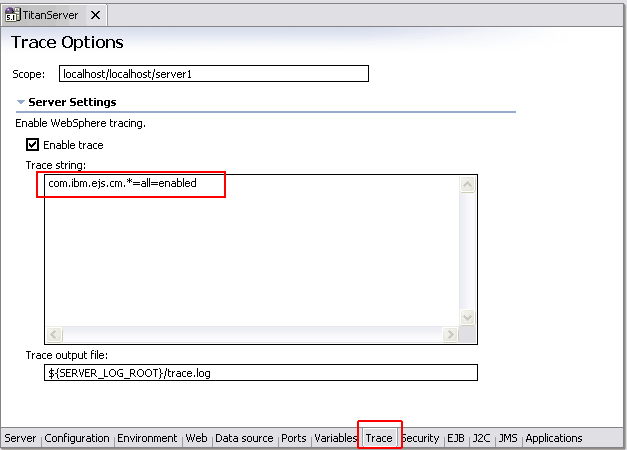
In the Server Configuration view, double-click the server to open it. The server editor opens.
Click the Trace tab at the bottom of the editor. 3
Select the Enable Trace check box.
In the Trace String text box, type a trace string that specifies the components, packages, or groups to trace. The trace string should be entered in the following format. component = trace_type = enabled, where component is the component for which to enable or disable tracing, and trace_type is the type of tracing to enable or disable. For example, to see how the connection manager pool is behaving, type com.ibm.ejs.cm.*=all=enabled in this box.
In the Trace output file field, type the directory where you want the log saved. 4
Save and close the server editor.
Trace strings
By default, the trace service for all WebSphere Application Server components is disabled. To request a change to the current state of the trace service, a trace string is passed to the trace service. This trace string encodes the information detailing which level of trace to enable or disable and for which components. 5
You can type in Trace strings, or construct them with a user-friendly GUI in the administrative console. Trace strings must conform to a specific grammar for processing by the trace service. The specification of this grammar follows:
TRACESTRING=COMPONENT_TRACE_STRING[:COMPONENT_TRACE_STRING]*

 COMPONENT_TRACE_STRING=COMPONENT_NAME=LEVEL=STATE[,LEVEL=STATE]*

LEVEL = all | entryExit | debug | event

STATE = enabled | disabled

COMPONENT_NAME = COMPONENT | GROUP
The COMPONENT_NAME is the name of a component or group registered with the trace service. Typically, WebSphere Application Server components register using a fully qualified Java classname, for example com.ibm.servlet.engine.ServletEngine. In addition, you can use a wildcard character of asterisk (*) to terminate a component name and indicate multiple classes or packages. For example, use a component name of com.ibm.servlet.* to specify all components whose names begin with com.ibm.servlet.
Examples of legal trace strings include:
com.ibm.ejs.ras.ManagerAdmin=debug=enabled
com.ibm.ejs.ras.ManagerAdmin=all=enabled,event=disabled
com.ibm.ejs.ras.*=all=enabled
com.ibm.ejs.ras.*=all=enabled:com.ibm.ws.ras=debug=enabled,entryexit=enabled
Trace strings cannot contain blanks. 6
Trace strings are processed from left to right. Specifying a trace string like
abc.*=all=enabled,event=disabledfirst enables all trace for all components whose names start with abc, then disables event tracing for those same components. This means that the trace string:
abc.*=all=enabled,event=disabledis equivalent to:
abc.*=debug=enabled,entryexit=enabled
