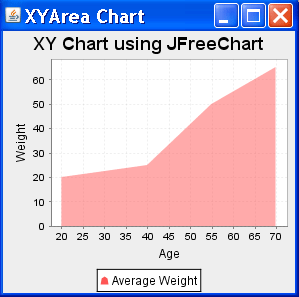
XYArea Chart
In this section we are providing you an example to create a XYArea Chart.
Description of Program
For creating a XYArea Chart we have to define a set of x,y coordinates by using an object of
XYSeries class. Then we add the data in this object that will show in our XYArea chart. After adding the data we make the object of
XYDataset of XYSeriesCollection type and add
XYSeries object in the dataset.
Description of Code
XYSeries series = new XYSeries("Average Weight");
For defining a set of x,y coordinates we use an object of XYSeries class.
Then we add the data in the XYSeries object by invoking add().
series.add(20.0, 50.0);
XYDataset xyDataset = new
XYSeriesCollection(series);
Now we have to create the object of XYDataset type of XYSeriesCollection and add the XYSeries object in the dataset.
JFreeChart chart =
ChartFactory.createXYAreaChart("XY Chart using JFreeChart", "Age", "Weight", xyDataset, PlotOrientation.VERTICAL, true, true, false);
After creating the dataset we create the XYArea Chart by invoking the createXYAreaChart()
method. This is a static method of ChartFactory class and its returns the object of JFreeChart type.This method syntax is:
Public static JFreeChart createXYAreaChart(java.lang.String title, java.lang.String xAxisLabel, java.lang.String yAxisLabel, XYDataset dataset, PlotOrientation orientation, boolean legend, boolean tooltips, boolean urls)
ChartFrame frame1=new ChartFrame("XYArea Chart",chart);
After this we create the object of ChartFrame. It used to display a chart.
Here is code of the program :
import org.jfree.chart.*;
|
Output of the Program :


