Matplotlib Examples - How to make a line graph in Matplotlib?
In this tutorial we are going to create simple line graph in Matplotlib library. You can run this code from Python or Jupyter notebook. The Matplotlib library is Python library for generating 2D and 3D data visualization in Python environment. It comes with the support for visualizing data of NumPy arrays in various formats including generate plots, histograms, power spectra, bar charts, errorcharts, scatterplots, and many more. The Matplotlib is one of most amazing library for visualizing data in the Python based applications.
The Matplotlib is used by most of the Data Scientist and Data Analyst in their application. The very simple example is to generate a line graph in Matplotlib and in this example we are going to teach you to make a line graph using this library.
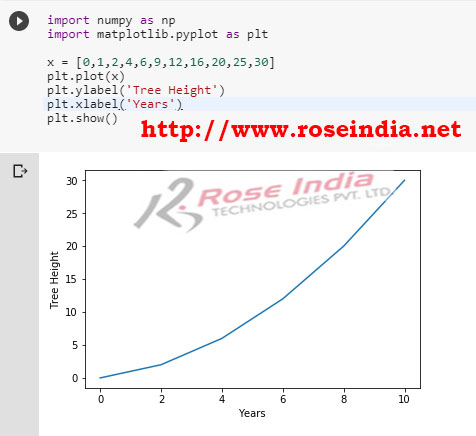
We will simply display the growth of tree in meters yearly. You can modify this code for visualizing other data also.
Here is the complete code example of making a line graph in Matplotlib:
import numpy as np
import matplotlib.pyplot as plt

x = [0,1,2,4,6,9,12,16,20,25,30]
plt.plot(x)
plt.ylabel('Tree Height')
plt.xlabel('Years')
plt.show()
If you run the program it will give following output:

Here we have created the heights of tree in meters in the x variable as shown below:
x = [0,1,2,4,6,9,12,16,20,25,30]
Now we can define y axis label with following code:
plt.ylabel('Tree Height')
And for defining the label of x axis following code is used:
plt.xlabel('Years')
To show the graph following code is used:
plt.show()
In this tutorial you learned to create line graph in Matplotlib Python library.
Check more tutorials at:
