Posted on: December 22, 2012 at 12:00 AM
The BCG matrix also called the Growth share matrix, B-Box, B.C.G. analysis, Boston Box, Boston Matrix, Boston Consulting Group analysis, portfolio diagram is a statistical chart developed by Bruce Henderson for the Boston Consulting Group in 1970 with an objective to help organisation analyse their strategic business units and product lines.
In broader terms of management, the BCG matrix can be successfully used as an effective tool of brand marketing, product management, strategic management, and portfolio analysis. The BCG matrix helps you decide where to allocate your investment in the business across your business portfolio.
 ADS_TO_REPLACE_1
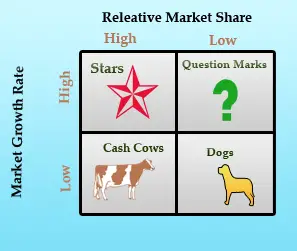
The Boston Group Consulting Matrix (BCG Matrix) analyses the product portfolio based on two factors that are divided into four major categories::
A portfolio of products can be analysed using the Boston Group Consulting Matrix. This categorises the products into one of four different areas, based on:
- Market share: Whether the product or services being sold or offered has high market share or low.
- Market growth: Whether there is increase in the number of potential customers for the product or services or not?
The key assumptions of the BCG Matrix are:ADS_TO_REPLACE_2
- Market share of a product can be uplifted through investment in marketing.
- An increase in the market share generates cash surplus.
- There is making cash surplus during the maturity phase of the product life cycle.
- The growth phase of the product life cycle is the best phase to dominate the market and build a strong market position.
The resurces are allocated to the busines units depending upon their location on the matrix grid.
Cash cows:
Business units falling under this category has high market share in the slow growing industry and mostly static and mature. This requires little investment as there is no need to invest high in a slow growing industry.ADS_TO_REPLACE_3
Dogs:
Units falling under dogs has relatively low market share and low growth rate in a mature and slow-growing industry. In this, your market presence is weak, so and doesnot give you profit and its very difficult to recover the situation. Thus, Dogs, it is thought, should be sold off or should or liquidated.
Question marks: The newly started business units generally fall under this category, which has low market share, but high growth potential. Question marks need more investment as they are in the initial phase but have the potential to become a star in future. These require in-depth analysis before making investment.
Stars:ADS_TO_REPLACE_4
The business units that have high market share in a fast-growing industry falls under the category of stars. The next phase of stars is the cash cows. Stars are the market leader due to their high growth rate. As soon as the growth slows stars become cash cows and can even become dogs due to low relative market share.
- com.oracle.oci.sdk >> oci-java-sdk-dns >> 3.31.0 Maven Repository
- com.oracle.oci.sdk >> oci-java-sdk-monitoring >> 1.15.4 Maven Repository
- software.amazon.awssdk >> lakeformation >> 2.25.23 Maven Repository
- software.amazon.awssdk >> greengrass >> 2.18.22 Maven Repository
- com.oracle.oci.sdk >> oci-java-sdk-vault >> 2.10.0 Maven Repository
- software.amazon.awssdk >> licensemanager >> 2.20.134 Maven Repository
- software.amazon.awssdk >> directconnect >> 2.15.46 Maven Repository
- com.oracle.oci.sdk >> oci-java-sdk-streaming >> 1.36.1 Maven Repository
- software.amazon.awssdk >> licensemanager >> 2.12.0 Maven Repository
- software.amazon.awssdk >> emrcontainers >> 2.17.73 Maven Repository

Ask Questions? Discuss: The BCG Matrix
Post your Comment