AreaChart Control in Flex4
The AreaChart Control is a MX Component. There is no Spark component.
The AreaChart Control is a MX Component. There is no Spark component.AreaChart control in Flex4:
The AreaChart Control is a MX Component. There is no
Spark component.
The AreaChart Control represents an area bounded by a line connecting the data
values. You can provide the data to the chart by using data provider property.
You will use <mx:horizontalAxis> or <mx:verticalAxis> and <mx:Series> in it. You
will use xField, yField, displayName and Form property for series. You can use
more than one series in it. There are six types of Form for display a chart:
segment, step, reverseStep, vertical, horizontal and curve. You can provide
color to series using areaFill and areaStroke property. The tag of AreaChart
Control is <mx:AreaChart>.
Example:
|
<?xml version="1.0" encoding="utf-8"?> <s:Application xmlns:fx="http://ns.adobe.com/mxml/2009" xmlns:s="library://ns.adobe.com/flex/spark" xmlns:mx="library://ns.adobe.com/flex/mx" minWidth="955" minHeight="600"> <fx:Declarations> <s:SolidColor id="s1" color="#990000" alpha=".2"/> <s:SolidColor id="s2" color="#808080" alpha=".2"/> <s:SolidColor id="s3" color="#cc00cc" alpha=".2"/> <s:SolidColorStroke id="scs1" color="#990000" weight="2"/> <s:SolidColorStroke id="scs2" color="#808080" weight="2"/> <s:SolidColorStroke id="scs3" color="#cc00cc" weight="2"/> </fx:Declarations> <fx:Script> <![CDATA[ import mx.collections.ArrayCollection; [Bindable] public var student:ArrayCollection = new ArrayCollection([ {Stream:"Management", Girls:1000, Boys:1400, TotalStudent:2400}, {Stream:"Computer Science", Girls:800, Boys:1200, TotalStudent:2000}, {Stream:"Mechanical", Girls:200, Boys:1500, TotalStudent:1700}, {Stream:"Electical", Girls:800, Boys:850, TotalStudent:1650}, {Stream:"Electronics", Girls:500, Boys:1000, TotalStudent:1500}, {Stream:"Civil", Girls:300, Boys:900, TotalStudent:1200} ]); ]]> </fx:Script> <s:Panel title="AreaChart control Example" width="678"> <s:layout> <s:HorizontalLayout/> </s:layout> <mx:AreaChart id="areachart1" showDataTips="true" paddingBottom="10" paddingLeft="10" paddingRight="10" paddingTop="10" dataProvider="{student}" width="574"> <mx:horizontalAxis> <mx:CategoryAxis categoryField="Stream" dataProvider="{student}"/> </mx:horizontalAxis> <mx:series> <mx:AreaSeries id="as1" xField="Stream" yField="TotalStudent" displayName="TotalStudent" areaFill="{s1}" areaStroke="{scs1}" form="curve"/> <mx:AreaSeries id="as2" xField="Stream" yField="Boys" displayName="Boys" areaFill="{s2}" areaStroke="{scs2}" form="curve"/> <mx:AreaSeries id="as3" xField="Stream" yField="Girls" displayName="Girls" areaFill="{s3}" areaStroke="{scs3}" form="curve"/> </mx:series> </mx:AreaChart> <mx:Legend dataProvider="{areachart1}"/> </s:Panel> </s:Application> |
Output:
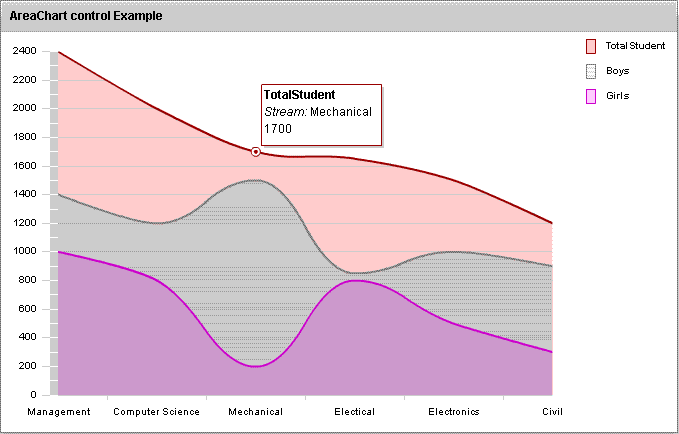
Running Application:
To view this page ensure that Adobe Flash Player version 10.0.0 or greater is installed.
