Chart Series Class in Flex4
The chart series classes are used for render a data in a chart control.
The chart series classes are used for render a data in a chart control.Chart Series Class in Flex4:
The chart series classes are used for render a data in a
chart control. The series classes are used mx.charts.chartClasses.Series class
package. All series classes are subclasses of this package. Every chart type has
a its own series class. for example, Bubble chart has a BubbleSeries class and
ColumnChart has a ColumnSeries class.
The primary use of series is what data to render in the chart. You can use the
series that what field in a data provider are used. You can set these fields in
x and y axis.
You will use the xField and yField property for set the fields which is used in
chart.
When you create a series you will specify a displayName property. The use of
this property is to show the label such as Data Tip objects for the user
understanding.
You can use more than one series type for a chart. You can apply the effect for
the series. The tag of series is <mx:series>.
Example:
|
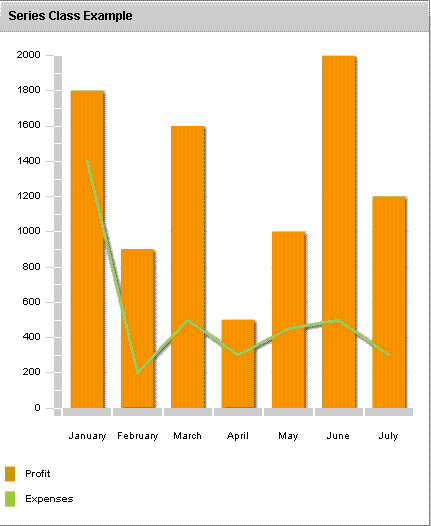
<?xml version="1.0" encoding="utf-8"?> <s:Application xmlns:fx="http://ns.adobe.com/mxml/2009" xmlns:s="library://ns.adobe.com/flex/spark" xmlns:mx="library://ns.adobe.com/flex/mx" minWidth="955" minHeight="600"> <fx:Declarations> <fx:Array id="data"> <fx:Object> <fx:Month>January</fx:Month> <fx:Profit>1800</fx:Profit> <fx:Expenses>1400</fx:Expenses> <fx:Amount>400</fx:Amount> </fx:Object> <fx:Object> <fx:Month>February</fx:Month> <fx:Profit>900</fx:Profit> <fx:Expenses>200</fx:Expenses> <fx:Amount>500</fx:Amount> </fx:Object> <fx:Object> <fx:Month>March</fx:Month> <fx:Profit>1600</fx:Profit> <fx:Expenses>500</fx:Expenses> <fx:Amount>400</fx:Amount> </fx:Object> <fx:Object> <fx:Month>April</fx:Month> <fx:Profit>500</fx:Profit> <fx:Expenses>300</fx:Expenses> <fx:Amount>300</fx:Amount> </fx:Object> <fx:Object> <fx:Month>May</fx:Month> <fx:Profit>1000</fx:Profit> <fx:Expenses>450</fx:Expenses> <fx:Amount>250</fx:Amount> </fx:Object> <fx:Object> <fx:Month>June</fx:Month> <fx:Profit>2000</fx:Profit> <fx:Expenses>500</fx:Expenses> <fx:Amount>700</fx:Amount> </fx:Object> <fx:Object> <fx:Month>July</fx:Month> <fx:Profit>1200</fx:Profit> <fx:Expenses>300</fx:Expenses> <fx:Amount>500</fx:Amount> </fx:Object> </fx:Array> </fx:Declarations> <s:Panel title="Series Class Example" width="431" height="526"> <mx:ColumnChart id="cchart" dataProvider="{data}" showDataTips="true" x="15" y="14"> <mx:horizontalAxis> <mx:CategoryAxis dataProvider="{data}" categoryField="Month"/> </mx:horizontalAxis> <!-- use of Series --> <mx:series> <mx:ColumnSeries xField="Month" yField="Profit" displayName="Profit"/> <mx:LineSeries xField="Month" yField="Expenses" displayName="Expenses"/> </mx:series> </mx:ColumnChart> <mx:Legend dataProvider="{cchart}" x="0" y="428"/> </s:Panel> </s:Application> |
Output:
Running Application:
To view this page ensure that Adobe Flash Player version 10.0.0 or greater is installed.
