Chart Axis Class in Flex4
The Axis class is used for set of values such as state name, stock ticker symbols, hours and days etc.
The Axis class is used for set of values such as state name, stock ticker symbols, hours and days etc.Chart Axis Class in Flex4:
The Axis class is used for set of values such as state
name, stock ticker symbols, hours and days etc.
Flex4 uses the following types of axes.
1. CategoryAxis: Category axis is used for a set of values state name, month
name etc to the axis. The tag of Category Axis is <mx:CategoryAxis>. You can use
this axis as a child tag of the <mx:horizontalAxis> or <mx:verticalAxis>.
2. LinearAxis: LinearAxis is used for a numeric data to the axis. You can set
the increment between the axis label. The tag of Linear Axis is <mx:LinearAxis>.
You can use this axis as a child tag of the <mx:horizontalAxis> or <mx:verticalAxis>.
3. LogAxis: LogAxis is used for a numeric data to the axis logarithmically. The
tag of LogAxis is <mx:LogAxis>. You can use this axis as a child tag of the <mx:horizontalAxis>
or <mx:verticalAxis>.
4. DtaeTimeAxis: DateTimeAxis is used for set time-based values such as days,
hours, weeks and years to the axis. The tag of DateTimeAxis is <mx:DateTimeAxis>.
You can use this axis as a child tag of the <mx:horizontalAxis> or <mx:verticalAxis>.
Example:
|
<?xml version="1.0" encoding="utf-8"?> <s:Application xmlns:fx="http://ns.adobe.com/mxml/2009"xmlns:s=" library://ns.adobe.com/flex/spark"xmlns:mx=" library://ns.adobe.com/flex/mx"minWidth=" 955" minHeight="600">xField=" Profit"yField=" Month"displayName=" Profit"/>xField=" Expenses"yField=" Month"displayName=" Expenses"/> </mx:series> </mx:ColumnChart></s:Application> |
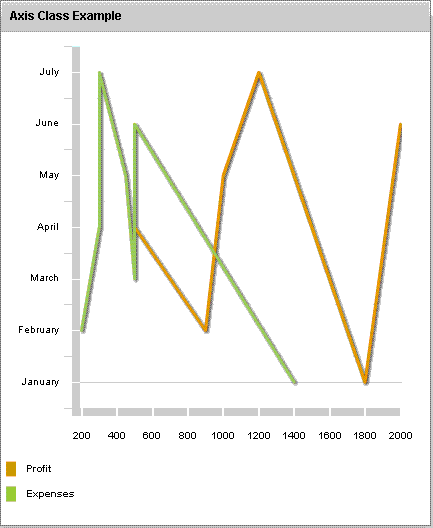
Output:
Running Application:
To view this page ensure that Adobe Flash Player version 10.0.0 or greater is installed.
